Uralkali is a leading international potash producer with a significant share of global potash production. The Company’s strategy is aimed at supporting Uralkali’s comprehensive development and retaining its leading position in the sector.
OUR MISSION
We produce potash fertilisers to ensure that people all over the world are provided with food. We are committed to supporting the development of our communities, the welfare of our employees, and the growth of the Company through the efficient and responsible development of unique potash deposits.
OUR VISION
OUR VALUES
Uralkali’s values are the core of our work. They underpin our continuous development and unite all of the Company’s employees from all departments regardless of their role or area of responsibility. Our values are designed to help each and every one of us in what we do.
Our activities are guided by the following values:
| Our vision | KPIs | Priorities | |
|---|---|---|---|
| Maintaining industry leadership positions |
|
|
|
| Focusing on enhanced relationship with end customers |
|
|
|
| Maintaining leadership positions in terms of cash cost of goods |
|
|
|
| Balanced approach to investment in expansion and return of free cash flow to shareholders |
|
|
|
| Focusing on people, communities, safety, and environment |
|
|
|
| Continued focus on best corporate governance practices |
|
|
|

 75.7
75.7
An effective risk management and internal control system remains one of the Company’s key priorities. As part of this system, measures are taken at all levels to reduce the probability of negative consequences which may result from certain events.
Uralkali’s risk management and internal control system is based on COSO ERM and ISO 31000.
The Company’s Board of Directors considers risk management issues. The performance of the risk management system is regularly reviewed by the Audit Committee of the Board of Directors.
Taking into account the significant opportunities and challenges we face in our markets, the continuous development of the risk management and internal control system is essential for the timely identification and assessment of risks and the effective performance of the tools for their management.
To this end, the Risk Committee under the CEO, which includes all functional directors, performs its work. The Risk Committee considers changes in the Company’s risk map, actual key risk indicators data and risk minimisation measures. This enables the Company to approach new or increasing risks in a timely manner and to develop adequate measures to minimise them.
All of the Company’s employees have the opportunity to report identified risks directly to their manager or via a hotline.

Internal documents governing the Risk Management System:

Risk management aspects are taken into account when determining the remuneration of the Company’s managers by means of a corresponding motivation system.
We strive to apply a responsible business approach to all areas of our operations. The Company is focused on environmental and social risks, which are included in the risk register and assessed, and management activities are developed. The Board’s Corporate Social Responsibility Committee reviews material risks related to sustainable development.
In keeping with the global agenda, PJSC Uralkali has also begun to consider possible risks and opportunities associated with climate change. The Company analyses the effects of climate change from different angles.
Another significant risk for the Company, which can be realised by natural disasters, is the occurrence of man-made accidents at production facilities. The Company carefully analyses the risks that could potentially cause accidents/incidents which include climate and natural disasters. The Company has emergency response procedures for various emergencies, including environmental ones.
If necessary, the Company will consider the necessary measures for the Group’s business adaptation in order to take into account the risks and opportunities associated with climate change.
This section describes major risk factors which may have a considerable impact on the financial and operating performance of Uralkali.
All estimates and forecasts contained herein should only be viewed taking these risks into account.
Other risks of which Uralkali is unaware or which are not currently deemed material, may become material in the future and have a considerable adverse effect on the Group’s commercial, financial and operating performance.
The Annual Report does not aim to give an exhaustive description of all risks that may impact the Company’s operations. Uralkali will disclose any necessary information in a timely manner according to the applicable Russian and international laws.
Our risk management approach is based on an understanding of our current risk exposure, risk probability and impact, and risk dynamics in the course of the Company’s operations.
| Risk | Risk Description | Management/Impact on Risk Level |
|---|---|---|
| Strategic and marketing risks | ||
| Failure to meet targets set for investment projects | Expansion CAPEX, costs associated with productivity increase and other investment costs of Uralkali are an important part of the Company’s expenditure budget. There are risks that investment projects’ deadlines and budgets will be exceeded, and risks that the projects’ technical parameters will not be achieved, or risks of project termination taking into account current factors and forecasts. |
The Company continuously monitors and controls the
implementation of its investment programme, and makes current
decisions based on the outlook of the market situation, while taking
into account the economic efficiency of the projects, the balance
of demand and supply in the market, its own financial capabilities,
and optimal project implementation time. When implementing
investment projects, the Company adheres to its project
management principles. Major investments are made after the design stage activities are completed and after the deadline, costs and feasibility of the projects are confirmed. |
| Change of the supply and demand balance in the main potash markets |
Change of the supply and demand balance in
the main markets of potash consumption due
to a decrease in demand and price of potash
as a result of political or economic factors
may have a negative impact on the Company’s
operations. The desire of potash producers to achieve high capacity utilisation in the context of insufficient demand can lead to potassium chloride oversupply and thereby to a reduction of global prices. All this may affect revenues and result in a decrease in the Company’s profits. |
The demand for potash in major sales markets does not align
with the level of supply, which can lead to a price reduction and a
decrease in the Company’s revenue, as well as affecting the ability to
meet assumed obligations. Uralkali’s management is developing a marketing strategy to promote potash and actively supports agricultural producers (e.g. by updating farmers’ calculators). The Company maintains a flexible production strategy and operations, increasing or decreasing production depending on current demand and market outlook. |
| Operating risks | ||
| Reduction of production capacity/ production volumes | External and internal factors, including accidents, downtime and a general decline in potash demand may affect potash production. | Uralkali continues to expand its production capacity and replace retired assets, maintaining them in working order. The Company sets the production targets in accordance with the current market situation and adopted strategy. |
| Lack of qualified employees | The specific nature of the Company’s business implies in-depth professional training and high qualification of its employees, particularly, in production, mining, and geology. Uralkali may face the difficulty of attracting and retaining staff with sufficient qualifications and the need for additional time and material resources to train and develop its employees. This can negatively affect the Company’s timely achievement of goals. |
Due to other companies’ plans to launch and develop a number
of mining projects in the Perm and neighbouring regions in the
upcoming years, the retention of qualified personnel is becoming
one of the main tasks for the Company. The Company constantly monitors the labour market and takes measures to retain personnel, particularly in production. It conducts surveys to determine the degree of personnel engagement and monitors reasons for resignation. The Company has implemented a system for in-house personnel assessment and training. For example, Uralkali has established a Corporate University, which is licensed to deliver 370 training programmes. Additionally, an e-learning system is being implemented and a talent pool programme is in place for key positions in the Company. Uralkali offers one of the most attractive social benefits packages in the industry and marketmatching salaries, as well as compensating mortgage payments to key employees. |
| Non-fulfilment of obligations by contractors, suppliers or customers |
Uralkali’s list of goods suppliers and
service providers includes a number of key
counterparties. Collaboration with such
counterparties is of strategic importance to
the Company. The failure of key partners, which are strategically important for the Company, to meet their contractual obligations may adversely affect Uralkali’s performance. |
The Company’s activities depend on monopolistic energy suppliers
and the Russian railways, as well as on unique exclusive suppliers of
a number of items. In the context of macroeconomic instability, suppliers and contractors may increase the price of their products and services, as well as refusing to supply them due to anti-Russian sanctions. Timely fulfilment by suppliers, contractors and buyers of their obligations related to the implementation of the Company’s investment projects is critical in order to ensure compliance with deadlines within the approved financial investments. The Company strives to ensure alternative suppliers and contractors are available for all its needs, and is focused on improving the execution and contractual discipline. Measures include strict control of contractual obligations performance through implementing monitoring procedures (including KYC, development of the credit policy and risk assessment model) in order to improve the quality of documents and cooperation with partners at various steps of contract execution, as well as ensuring timely and complete execution of the obligations assumed by the parties. |
| Expenditure increase | Risks of production costs increase may occur due to wear-and-tear of production equipment, utilisation of obsolete technologies, the inefficient spending of funds on operating activities or growth of energy prices. | The Company undertakes thorough budgeting and planning activities, ensures continuous monitoring and control of expenses of its bodies and officials, and constantly improves performance discipline, as well as implementing additional controls that allow it to stay on budget and keep costs at an approved level. |
| Currency rates fluctuations and interest rates growth | Inflation processes and currency fluctuations significantly affect the financial performance of the Company and may lead to a reduction of net profit. |
Part of the Company’s loan portfolio consists of loans with floating
interest rates and is denominated in foreign currency.
The Company minimises the currency fluctuation risks and the risk of a significant increase in the floating interest rate by means of financial derivatives and other available hedging instruments. |
| Environmental risks | ||
| Environmental and mining risks | Uralkali’s ore mining and beneficiation activities are exposed to risks associated with the geological structure of the Verkhnekamskoye deposit of potassium salts, and general mineral exploration, extraction and processing risks including possible flooding, fires and other emergencies that can lead to unforeseen costs and a general decline in the efficiency of Company’s operations. |
Each year the Company develops mining plans, which include an
extensive safety section. The Company, if needed, audits the sufficiency of measures aimed at minimising mining risks. Mining safety monitoring is one of the Company’s key priorities that is regularly reviewed by the CEO, the Board of Directors and their respective committees. |
| HSE non-compliance | Uralkali’s activities and the use of its property are regulated by various health, safety and environmental laws and regulations. Additional costs and obligations may be incurred due to the need to comply with these requirements. |
The Company pays considerable attention to industrial safety,
treating human life and health as the highest value, and making HSE
compliance its key priority. The Company has adopted safety standards, including Cardinal Safety Rules. Regular safety training and examinations of personnel are held; a set of measures to prevent occupational diseases are in place. The Company also pays close attention to complying with environmental legislation and improving its environmental performance. All recommendations and instructions from environmental supervisory authorities are duly taken into account and followed. |
| Political and legal risks | ||
| Risks related to the incidents at Berezniki-1 and Solikamsk-2 | The flooding of Uralkali’s Berezniki-1 in October 2006, as well as the incident at Solikamsk-2 in 2014 had a significant impact on the size of mineral reserves and may lead to additional costs, losses and obligations. |
The Company adheres to the safety and social responsibility policies
and adopts a conservative approach. The Company follows its social responsibility policy and maintains a constructive and consistent relationship with state authorities to respond to any issue in a timely manner. |
| Political and regulatory risks |
Uralkali operates in Russia and a number of
developing markets which are exposed to
higher risks than more developed markets,
including significant legal, economic and
political risks. The Company may breach applicable laws or regulations in the markets where it operates. Certain measures taken by governmental bodies or increased regulation could lead to additional costs, as well as affect creditors’ expectations. Risks of additional obligations, costs and restrictions for Uralkali due to audits by tax authorities, the federal health and safety agency (Rostechnadzor) and other regulators. Results of such audits may lead to imposing additional obligations, costs and restrictions on Uralkali. |
Uralkali is registered in Russia and operates in a number of
developing markets that are exposed to higher risks than more
developed markets, including legal, economic and political risks,
such as rapidly changing legislation and legal practice. The Company’s sustainable development depends on its ability to be fully compliant with legal requirements and other binding standards, rules and instructions. The Company has developed a set of interconnected measures to ensure compliance of its activities. The Company also monitors any relevant legislative changes in all applicable jurisdictions and liaises with supervisory authorities to promptly adjust its documents and practices. The Company’s corporate governance procedures enable it to quickly make necessary operational and strategic decisions at different managerial levels. |
| Compliance with applicable legislation and internal policies | Uralkali is subject to the laws of Russia and other countries of its operations, including anti-monopoly legislation. Claims, including anti-monopoly claims, may create additional costs for the Company. |
The Company is subject to special state regulations in various
jurisdictions. Due to macroeconomic instability, regulators can
tighten their requirements. The Company constantly improves its internal control system in order to ensure compliance of its activities with the requirements of applicable law including anti-monopoly legislation. |
PJSC Uralkali organises a corporate insurance programme as a protection measure against risks in partnership with major Russian insurance companies and the international reinsurance market.
The Company continuously aims to improve the terms of insurance coverage and closely cooperates with the insurance and reinsurance community.
Insurance is only one way of minimising risk and the use of different methods helps reduce the maximum aggregate risk.
The Company’s risk management and internal control system is regularly improved. In 2020, the Company plans to hold training sessions on risk management for new managers of the Company. The same sessions were also conducted in 2018.
Corporate insurance programme includes the following:
Uralkali improved its financial performance in 2019 despite a relatively difficult situation in the global potash market our revenue grew by 1%1 in the reporting period, and our adjusted EBITDA by 8%. In 2019, the Company continued with its strategy to reallocate export volumes to higher-margin markets while effectively managing its capital flows.
Overall, the challenging potash industry environment did not adversely affect Uralkali’s access to long-term financing: in the reporting period, the Company placed Eurobonds, and attracted the largest syndicated loan and the first dual currency loan in its history.
Uralkali’s strategy continues to be underpinned by its sustainable development principles committed to social responsibility, reliability, and other elements that will support the organic growth of both the Company and the development of its region of presence.

STRENGTHENING INDUSTRY LEADERSHIP POSITIONS
Net revenue is the key financial metric that measures the success of our revenue maximisation strategy. We use net revenue to eliminate the effect of trading transportation costs in order to achieve a more relevant crossindustry comparison.
Net revenue represents revenue net of freight, railway tariffs, and rent of wagons, and transshipment costs.
The net revenue growth was driven by an increase in prices which peaked in the first quarter of 2019, and were higher on average compared to 2018.
Output per capita (production personnel) measures manpower productivity and how efficiently we can produce our product.
Potash fertilisers output divided by average production personnel headcount.
The relatively tough trends in the global potash market did not have a significant impact on this indicator.
FOCUS ON RELATIONSHIP WITH END CONSUMERS
Achieved production shows the volume of products produced by the Company, which can be adjusted to reflect market conditions and the current strategy.
The volume of potash fertilisers produced within the reporting period.
Uralkali partially reduced the production of its main products in the second half of 2019, based on market conditions and scheduled maintenance shutdowns.
Sales volumes is one of the indicators representing the efficiency of our logistics, trading performance, and routes to market.
The volume of potash fertilisers sold within the reporting period.
The Company studies market trends and adjusts its production and sales volumes to meet global demand.
MAINTAINING A LEADERSHIP POSITION IN CASH COST OF GOODS
Cash cost of goods sold (COGS) per tonne measures our competitive cost position in the industry.
COGS less depreciation and amortisation per tonne and cost of goods for resale.
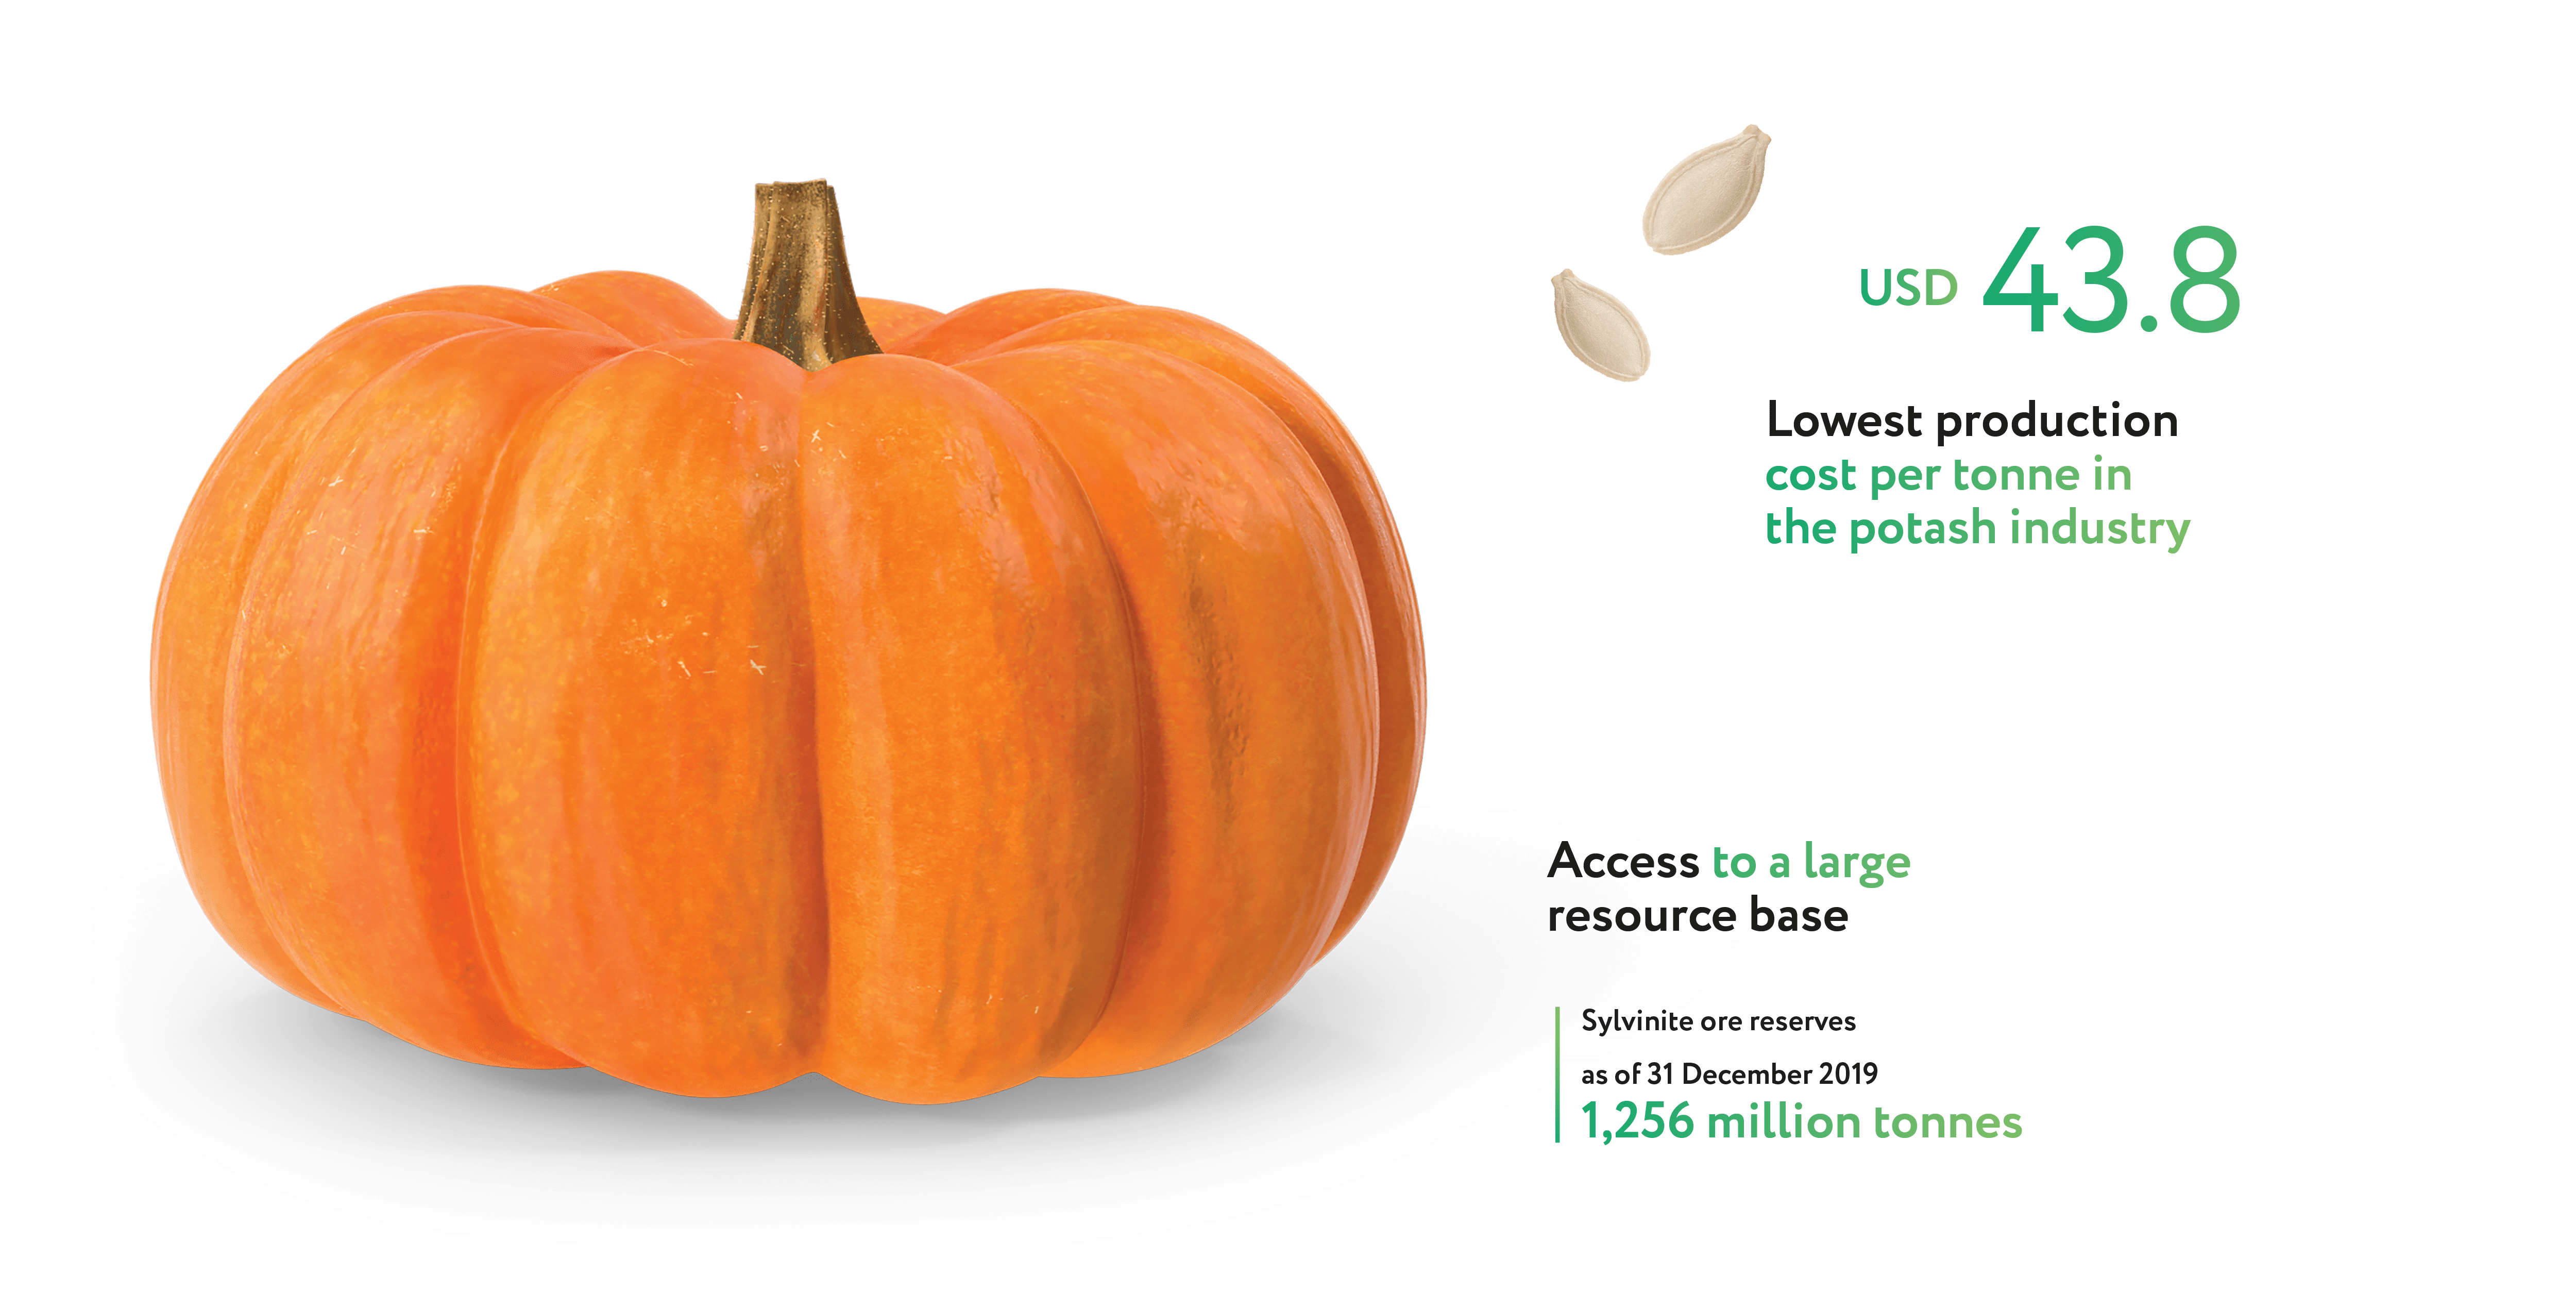
In 2019, cash COGS per tonne of KCl increased to USD 43.8. The key driver was an increase in the number of repairs against the previous year and higher ore transportation costs as part of COGS.
Maintenance CAPEX shows efficiency of our operating facilities maintenance.
Capital expenditures aimed at maintaining the current production facilities in sound technical condition.
The 2019 maintenance CAPEX is in line with levels for 2018. Equipment was replaced and panels were prepared for mining in accordance with the production cycle in the reporting period. Investments were also made in the construction of hydraulic stowage facilities to ensure the safety of mining operations.
The EBITDA margin demonstrates our pricing success, cost efficiency, advantages of being a pure-potash producer, and reflects the attractive fundamentals of our business.
Adjusted EBITDA divided by net revenue. Adjusted EBITDA is operating profit plus depreciation of fixed assets* and amortisation of intangible assets and depreciation of right-to-use assets, as well as impairment of fixed assets and non-recurrent expenses.
EBITDA margin increased by 3 p.p. in 2019 and is in line with the average over the last five years.
BALANCED APPROACH TO INVESTMENT IN EXPANSION AND RETURN OF FREE CASH FLOW TO SHAREHOLDERS
Net debt/EBITDA measures how robust our capital structure is and how we manage our balance sheet.
Net debt is debt (including bank loans and bonds) less cash and deposits.
The drop in the net debt/EBITDA ratio reflected the EBITDA growth and decrease in net debt.
Expansion CAPEX reflects how efficiently we bring new potash capacity on line.
Capital expenditures attributable to the expansion programme.
The Company’s expansion programme remains one of the most efficient in the industry. In 2019, the total expansion CAPEX was in line with our programme of new capacity launches to ensure the Company maintains its leading market position.
FOCUS ON PEOPLE, COMMUNITIES, SAFETY AND ENVIRONMENT
FIFR is the core indicator of responsible health and safety management. It is central to our focus on operational excellence.
FIFR is calculated based on the number of fatalities per 200 thousand hours worked.
We deeply regret the deaths of 3 Company employees in 2019. All cases were investigated, and measures have been taken to prevent similar accidents in the future.
LTIFR reflects work-related injury frequency. The rate helps us to measure the efficiency of our health and safety initiatives and controls across our operations.
LTIFR is calculated based on the number of lost time injuries per 200 thousand hours worked.
In 2019, 18 accidents were registered at Uralkali’s enterprises and subsidiaries in Russia, including 3 accidents with fatal outcome. All cases were investigated; the Company has taken all of the necessary measures to prevent similar accidents in the future.
Social investments demonstrate and reflect the Company’s important role in the community in which it operates.
Total amount of social expenditures including on charity, infrastructure, and sports.
In 2019, Uralkali continued to support sports activities, donate to charity, and contribute to the development of the region where it operates.
FOCUS ON PEOPLE, COMMUNITIES, SAFETY AND ENVIRONMENT
Voluntary labour turnover represents the ability to retain our people, which is key to the Company’s strategy to be positioned as an employer of choice.
Turnover is the number of permanent employee resignations as a percentage of total employees (excl. transfer to another employer and staff reduction). Since 2019, foreign companies of the Group have been included in the indicator. Data were revised retrospectively starting from 2017.
In 2019, the effective HR Policy aimed at strengthening employee engagement contributed to a decline in this indicator.
The average annual salary per employee indicator in the main production unit measures how competitive we are on the market in relation to attracting and retaining the best people.
The annual payroll is divided by the average number of employees in the main production unit, excluding top managers and Moscow rep.office.
In 2019, average annual salaries denominated in US dollars grew by 3% y-o-y mainly thanks to salary indexation. The Company offers all of its employees competitive salaries, recognises their contribution, and encourages efficient work and professional development.
Energy utilisation as a result of a number of mitigating actions demonstrates how the Company responds to climate change
Energy consumed (electricity) per tonne of production for industrial needs.
An increase in energy consumption per tonne of production reflected the decrease in production volumes due to strategic factors.
CONTINUED FOCUS ON BEST CORPORATE GOVERNANCE PRACTICES
CREDIT RATING MAINTENANCE

Investment-grade ratings acknowledge that Uralkali is a fi rst-class borrower with a strong industry position, balanced fi nancial policy, and prudent risk management that adheres to leading corporate governance standards.

Type of ratings assigned to the Company by four rating agencies: Fitch, Moody’s, Standard & Poor’s, and Expert RA.

In 2019, Fitch, Standard & Poor’s, and Moody’s improved the outlook on the Company’s rating from Stable to Positive.
THE COMPANY’S GOVERNANCE AND TRANSPARENCY ARE NOT NEGATIVELY CITED BY RATING AGENCIES AND REGULATORS

The corporate governance system, based on best international standards, is fundamental to shareholder trust and underpins our attractiveness to investors.
Any defects in the Company’s corporate governance, transparency, disclosure or ethical standards, practices or procedures cited by any rating agency or regulator with jurisdiction over the Company’s securities as a reason for an adverse decision with respect to the Company.
Corporate governance continued to be one of the Company’s key priorities in 2019. The decision-making process in the Company is in line with legal and regulatory requirements, and the Company constantly improves its corporate governance practices in order to comply with the best international standards.
Uralkali aims to retain and increase its share of the global potash market. The Company has a production capacity development programme in place and invests in the modernisation of its facilities on an ongoing basis. The Company is progressing with its capacity development programme whilst taking into consideration the current situation and expected developments in the global potash market.

In 2019, we continued the construction of surface complex facilities, completed work on energy facilities, our shaft construction works approached their final stage, and the first designs of the underground complex were drafted.
In 2019, shaft sinking continued, and the Company began to construct surface complex facilities.
In 2019, construction of the mine surface complex continued.
In 2019, engineering documentation was developed, and preliminary works for shaft sinking began.
In order to increase production capacity for granular MOP, equipment is being upgraded to improve its productivity, and additional new process equipment is being installed. To improve production efficiency, programmes are being implemented to increase the section load and the extraction rates. As part of the capacity maintenance works, mine panels are being prepared for operation, worked-out sectors are being prepared for backfilling, and the current equipment is being replaced and upgraded with state-of-the-art technology, which will facilitate further improvements.
Despite the relatively challenging situation in the global potash market in Q4 2019, Uralkali managed to improve its financial performance in the reporting period. The average export price on a delivery basis1 in US dollars in 2019 was 8% higher than in 2018, due to price changes for the Group’s main products in global potash markets.
Compared to 2018, the Group’s results were as follows:
Despite the reduction of sales volumes in 2019, revenue increased by 1% against prior year comparatives, amounting to USD 2,782 million. Total sales volumes decreased by 12% compared to 2018 and amounted to 9.8 million tonnes (11.1 million tonnes in 2018), due to adverse weather conditions that affected demand for potash and the Group’s export sales during 2019.
The main factor that affected revenue and offset the reduction in sales volumes during the period was an 11% growth in the weighted average price (USD 268 per tonne in 2019 compared to USD 242 per tonne in 2018). Prices for the Group’s main products peaked in the first quarter of 2019, followed by a gradual decline. Other sales (carnallite enriched, pit-run industrial sodium, solutions of sodium chloride and magnesium, as well as the revenue from sales of other services and goods, namely, nitrogen fertilisers) amounted to 13% of total revenue in 2019, or USD 364 million (USD 276 million in 2018). Significant growth in other revenue is due to the Company’s new activities — trading operations on the purchase and sale of nitrogen fertilisers in the African market.
90% of the Group’s exported products in 2019 were shipped by sea, mainly through its own terminal in the port of St. Petersburg. The Group’s maritime transportation export costs include the railway tariffs and rent of wagons from Berezniki and Solikamsk to ports of transshipment, transshipment expenses at the seaports and freight costs (except for deliveries on a FOB basis).
10% of export sales were transported by rail, including 8% to China and 2% to other regions. The Group’s costs for these deliveries include railway tariffs and railcar rental.
Freight
Effective freight rate in US dollars decreased by 3% per tonne of product shipped by sea on a CIF/CFR basis in 2019 against 2018 and amounted to USD 33 per tonne (USD 34 per tonne in 2018).
The reduction in freight rates was mainly due to alterations in the shipment structure. At the same time, the introduction of the use of expensive low-sulfur fuel around the world and subsequent higher fuel costs affecting shipowners since the end of 2019 did not significantly affect the freight rate.
In addition, the winter of 2019/2020 was abnormally warm, as a result of which freight rates for shipments from St. Petersburg in November– December 2019 remained at the same levels (without significant ice component).
The Company also incurred barge freight costs within the USA, which are less significant than shipping products by sea.
Railway tariffs
The Company ships directly to its customers in Northern China, Europe, and the CIS countries by rail. The weighted average railway tariff1 to St. Petersburg increased by 7% in 2019 (a 4% increase in US dollars terms) mainly due to tariff indexation and the expiration of the decreasing factor on the loaded tariff to stations of Oktyabrskaya railroad.
The tariff to China increased by 3% (a 1% decrease in US dollars terms), mainly due to tariff indexation.
Transshipment
In 2019, transshipment costs remained at 2018 levels, amounting to USD 21.2 million.
Net revenue is sales revenue, net of variable distribution costs on freight, railway tariff and rent of wagons, and transhipment costs.
According to the consolidated financial statements prepared in accordance with International Financial Reporting Standards (IFRS), net revenue increased by 4%, to USD 2.36 billion in 2019 against 2018 due to an 11% growth in export prices on the FCA basis, which was partially offset by a 12% decrease in sales volumes.
Cash COGS amounted to RUB 2,837 per tonne in 2019, 6% higher than in 2018 (a 3% increase in US dollar terms to USD 43.8 per tonne). The main reasons for an increase in cash cost per tonne were higher volumes of repairs compared to the previous year and greater expenses for transportation between mines.

Labour
Average salaries at the Group in 2019, with the exception of top management’s remuneration, rose by 0.5% compared to 2018 (a 2.7% reduction in US dollar terms). The growth in the average salary in RUB was a result of salary indexation due to increased consumer prices. Average expenses per one employee at the Group, excluding the remuneration of senior management, amounted to around USD 1,090 per month against USD 1,120 in 2018 (RUB 70.5 thousand and RUB 70.2 thousand, respectively).
Around 20.3 thousand people worked for the Group in 2019.
Fuel and energy
The potash production process is very energy-intensive. Fuel and energy expenses largely depend on production volumes and are denominated in roubles. Electric power and gas were purchased at unregulated rates. However, prices of electricity and gas transmission services were regulated by the government. The Company’s power needs were partially met through its own power generation. The effective gas tariff in USD remained flat in 2019 (growth by 3.1% in RUB terms) and amounted to USD 62 per 1,000 m3. The effective tariff on purchased electricity in USD increased by 5% in 2019 (a 9% increase in RUB terms) compared to 2018 and amounted to USD 49 per 1,000 kWh.
Other cash costs in cost of goods
Other cash costs include costs of materials, repairs, and transportation between mines, etc.
These are made up of variable costs (costs of production materials and transportation between mines), and fixed costs (costs relating to outsourced services and materials for repairs).
The reduction in production volumes as a result of market conditions allowed the Company to carry out planned shutdown maintenance works, which contributed to the increase in repair costs. Repair costs increased by 11% in 2019 compared to 2018 (USD 71.8 million in 2019 and USD 64.7 million in 2018). In addition to shutdown maintenance, the increase in costs was also due to the postponement of part of the repair work in 2018 to 2019, as well as higher materials and services costs.
In 2019, general and administrative cash expenses1 increased by 2% in USD against 2018. The primary component of general and administrative cash expenses was employee benefits (59%).
The 11% appreciation of RUB against the US dollar at 31 December 2019 compared to the beginning of the year resulted in a foreign exchange gain of USD 417 million and a fair value gain of USD 130 million on derivative financial instruments, primarily as a result of the revaluation of the foreign currency loan portfolio.
The decrease in the Company’s debt level as well as the attraction of financing at lower rates resulted in a 25% reduction in interest expenses in 2019 compared to 2018 (USD 217 million and USD 288 million, respectively).
In 2019, adjusted EBITDA increased by 8% compared to 2018, amounting to USD 1.58 billion. The EBITDA margin1 was 67% in 2019.
In 2019, the Company made a decision to write off the property, plant and equipment related to the liquidation of consequences of the accident at the Solikamsk-2 mine, which completed their purpose prior to the end of their expected value-added use. The volume of this writing-off amounted to USD 10.5 million. During the reporting period, the Company also incurred unplanned social and charitable expenses in the amount of USD 28 million. When calculating the adjusted EBITDA for 2019, these expenses in the amount of USD 38.5 million were assumed to be non-recurring.
No income and expenses were taken as one-off and excluded from calculation of the adjusted EBITDA in 2018.
Calculation of adjusted EBITDA , USD mln
| 2019 | 2018 | |
|---|---|---|
| Operating profit | 1,255 | 1,202 |
| Depreciation of property, plant and equipment and amortisation of intangible assets in the form of rights of use | 272 | 257 |
| Impairment of property, plant and equipment | 12 | - |
| One-off expenses | ||
| Non-recurring writing-off of facilities related to the liquidation of the accident at the Solikamsk-2 mine | 10.5 | - |
| Unplanned charity and social expenses | 28 | - |
| Adjusted EBITDA | 1,578 | 1,459 |
In 2019, total CAPEX amounted to USD 378 million, 42% of which accounted for expansion CAPEX. The Group’s main expenses in 2019 were related to the construction of new mines: Ust-Yayva and Solikamsk-2. Moreover, projects aimed at increasing production volumes of standard and granular products at existing mines were implemented in 2019 as part of the capacity expansion programme.
The Company’s expansion programme remains one of the most efficient in the industry. In 2019, expansion CAPEX amounted to USD 158 million. This indicator was in line with the scheduled and planned commissioning of capacities to maintain its leading market position. Maintenance CAPEX in 2019 was in line with historical levels and amounted to USD 220 million. This included equipment replacement, and preparation of panels for testing in accordance with the production cycle. The Group additionally invested in the construction of hydraulic stowage facilities, to ensure the safety of mining operations.
Cash funds received from the Group’s operating activities in 2019 decreased by 32% against prior-year comparatives, to USD 0.7 billion. The decrease in cash inflows was due to accumulation of inventories related to a decrease in sales volumes resulting from negative market conditions, as well as increased income tax payments.
As of 31 December 2019, the Company’s net debt amounted to USD 4.84 billion. At that, the cash balance amounted to some USD 0.48 billion, and total debt amount to USD 5.32 billion.
In May 2019, the Company signed a USD 725 million and EUR 650 million 5-year pre-export facility agreement with 13 international banks. The interest rate is 1 month LIBOR + 1.9% for US dollar tranches and EURIBOR +1.7% for euro tranches.
In October 2019, the Group issued Eurobonds at a nominal value of USD 500 million, with a coupon of 4.00% p.a. maturing in 2024.
At the end of 2019, the effective interest rate amounted to 4.50% on loans in USD and 1.64% on loans in EUR.